Free Access
Fig. 1
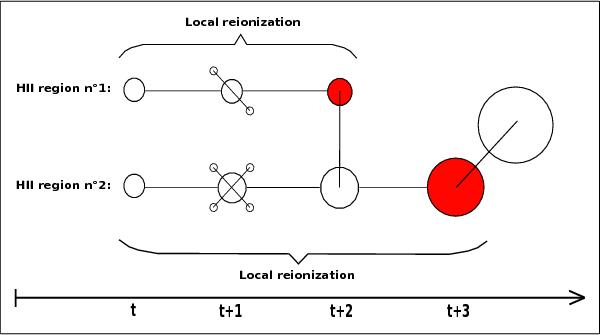
Illustration of the follow-up of the local reionization histories for two HII regions. The red circles symbolize that the HII regions undergoe a major-merger event with another region larger or equal in volume.
Current usage metrics show cumulative count of Article Views (full-text article views including HTML views, PDF and ePub downloads, according to the available data) and Abstracts Views on Vision4Press platform.
Data correspond to usage on the plateform after 2015. The current usage metrics is available 48-96 hours after online publication and is updated daily on week days.
Initial download of the metrics may take a while.