Fig. 4
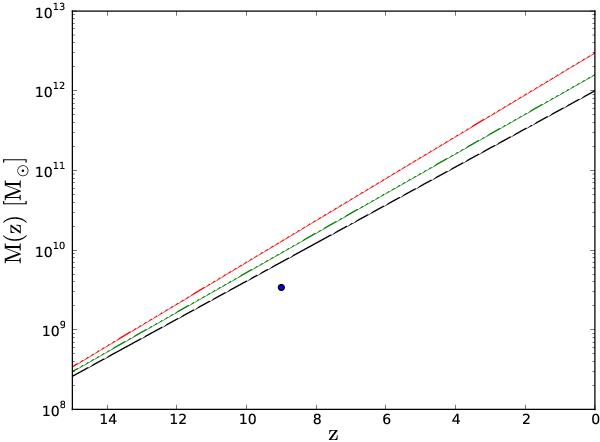
Example of dark matter halo growth calculated according to the model of Wechsler et al. (2002) (Eq. (2)) with the fits of McBride et al. (2009). Black, green, and red curves represent the mass evolution of a MW-type halo with M0 = 1 × 10¹² M⊙ as in Battaglia et al. (2005), a M31 halo with M0 = 1.6 × 10¹² M⊙ as in Klypin et al. (2002), and an object that will have the mass our Local Group of galaxies today: M0 ~ 3 × 10¹² M⊙ as in Klypin et al. (2002). For comparison, the blue dot stands for the mass of an MW-type halo at z = 9 as found in numerical simulation by Iliev et al. (2011).
Current usage metrics show cumulative count of Article Views (full-text article views including HTML views, PDF and ePub downloads, according to the available data) and Abstracts Views on Vision4Press platform.
Data correspond to usage on the plateform after 2015. The current usage metrics is available 48-96 hours after online publication and is updated daily on week days.
Initial download of the metrics may take a while.