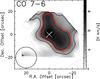
Fig. 3
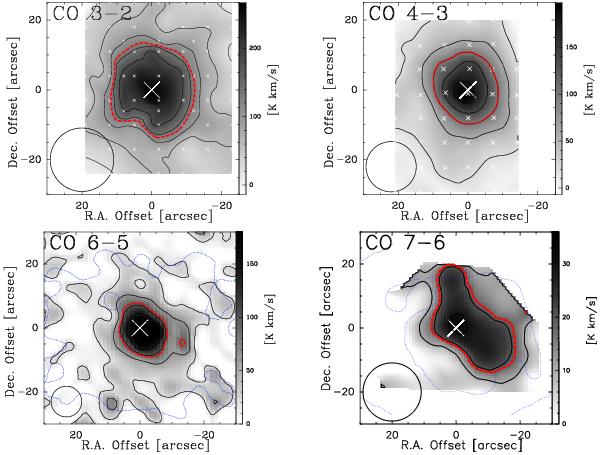
Moment-zero images of multiple-J CO transitions. Big crosses mark the central position of Circinus; small crosses in the upper panels denote the sampled positions. Upper left: 12COJ = 3 → 2; upper right: 12COJ = 4 → 3; lower left: 12COJ = 6 → 5; lower right: 12CO J = 7 → 6. Circles in the lower left of each panel show the beam. The 12COJ = 7 → 6 map was convolved to an angular resolution of 18′′. Contour levels are 20, 60, ..., 180 Kkms-1in steps of 40 Kkms-1 for 12COJ = 3 → 2, J = 4 → 3, and J = 6 → 5, and 10, 20, 30 Kkms-1 for 12COJ = 7 → 6 (1σ = 1.9, 3, 10, and 3 Kkms-1 for 12COJ = 3 → 2, J = 4 → 3, J = 6 → 5, and J = 7 → 6). Red (thick dotted) contours present the half maximum level of all images. The thin dotted lines in the lower two panels denote the regions that have been scanned with higher S/N than other regions farther away from the centers (see Sects.2 and 3.1.3). The outer dotted lines in the 12COJ = 7 → 6 map are related to masking.
Current usage metrics show cumulative count of Article Views (full-text article views including HTML views, PDF and ePub downloads, according to the available data) and Abstracts Views on Vision4Press platform.
Data correspond to usage on the plateform after 2015. The current usage metrics is available 48-96 hours after online publication and is updated daily on week days.
Initial download of the metrics may take a while.