Fig. 1
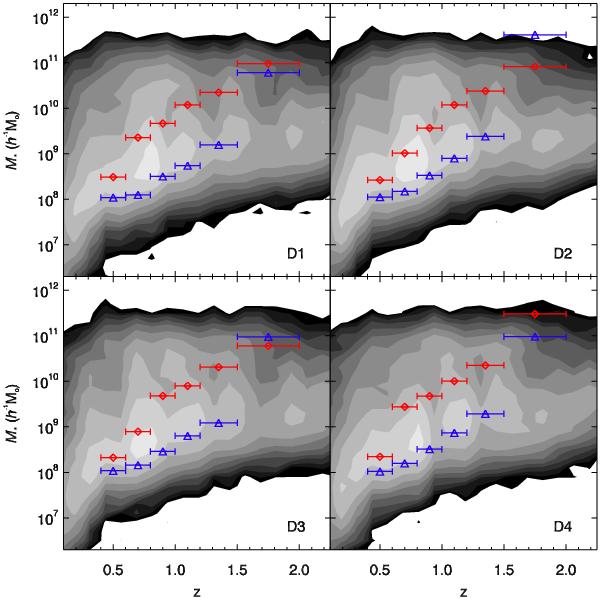
Estimated mass completeness limits of the WIRDS data. The greyscale contours show the distribution of the i < 25 galaxy population, normalized by the area of each field. Red diamonds with horizontal error bars show the estimated mass completeness limits for consecutive bins in redshift corresponding to a magnitude cut of i = 25 for passive galaxies. Blue triangles with error bars show the same for star-forming galaxies.
Current usage metrics show cumulative count of Article Views (full-text article views including HTML views, PDF and ePub downloads, according to the available data) and Abstracts Views on Vision4Press platform.
Data correspond to usage on the plateform after 2015. The current usage metrics is available 48-96 hours after online publication and is updated daily on week days.
Initial download of the metrics may take a while.