Fig. 8
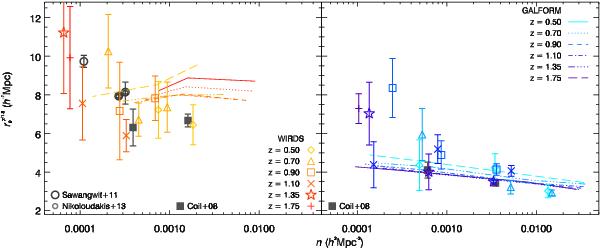
Clustering strength,  as a function of number density, split by galaxy type, with passive galaxies shown
in the left hand panel and star-forming galaxies in the
right hand panel. In both panels, the coloured symbols show the
results for the WIRDS data, whilst the lines show the predictions from
galform. The grey symbols show results from the literature, with the
z =
0.3,0.5,0.7 LRG results from
Sawangwit et al. (2011, large open
circles), the z =
0.7,1.0 LRG results from Nikoloudakis et al. (2013, small open circles) and the passive
(plotted left) and star-forming (plotted in the right
panel) z =
1 results of Coil et al. (2008,
filled squares in both panels).
as a function of number density, split by galaxy type, with passive galaxies shown
in the left hand panel and star-forming galaxies in the
right hand panel. In both panels, the coloured symbols show the
results for the WIRDS data, whilst the lines show the predictions from
galform. The grey symbols show results from the literature, with the
z =
0.3,0.5,0.7 LRG results from
Sawangwit et al. (2011, large open
circles), the z =
0.7,1.0 LRG results from Nikoloudakis et al. (2013, small open circles) and the passive
(plotted left) and star-forming (plotted in the right
panel) z =
1 results of Coil et al. (2008,
filled squares in both panels).
Current usage metrics show cumulative count of Article Views (full-text article views including HTML views, PDF and ePub downloads, according to the available data) and Abstracts Views on Vision4Press platform.
Data correspond to usage on the plateform after 2015. The current usage metrics is available 48-96 hours after online publication and is updated daily on week days.
Initial download of the metrics may take a while.