Fig. 1
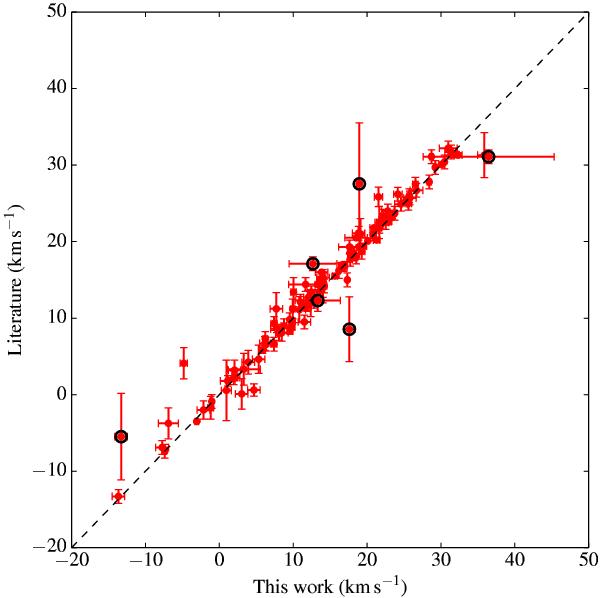
Average RV values determined in this work versus those from the literature, where values were available for comparison. Error bars represent the standard deviation from the mean value for each source. If uncertainties were not quoted in the literature, the average uncertainty from all other values, 0.90 km s-1, was used. If only one data epoch was available, the overall standard deviation for the SACY sample, 0.89 km s-1, derived in this work was used to represent the uncertainty. Black rings indicate identified multiple systems. A line representing a 1:1 relation has been drawn for base comparison.
Current usage metrics show cumulative count of Article Views (full-text article views including HTML views, PDF and ePub downloads, according to the available data) and Abstracts Views on Vision4Press platform.
Data correspond to usage on the plateform after 2015. The current usage metrics is available 48-96 hours after online publication and is updated daily on week days.
Initial download of the metrics may take a while.