Fig. 4
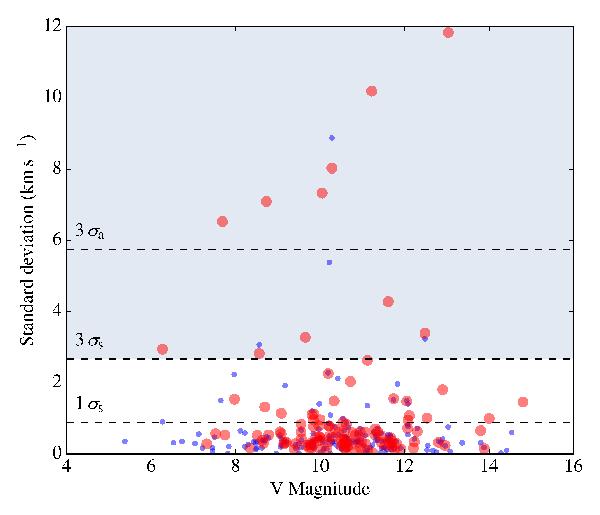
Standard deviation in RV values for SACY sources, excluding known SB2 systems, as a function of V magnitude. UVES and FEROS values – blue dots and UVES, FEROS and archival data – red circles.The variables, 1σs and 3σs, represent one standard deviation and three standard deviations respectively, for both UVES and FEROS data. The shaded area contains SB1 candidate multiple systems. The variable 3σa, represents three standard deviations including archival data.
Current usage metrics show cumulative count of Article Views (full-text article views including HTML views, PDF and ePub downloads, according to the available data) and Abstracts Views on Vision4Press platform.
Data correspond to usage on the plateform after 2015. The current usage metrics is available 48-96 hours after online publication and is updated daily on week days.
Initial download of the metrics may take a while.