Fig. 7
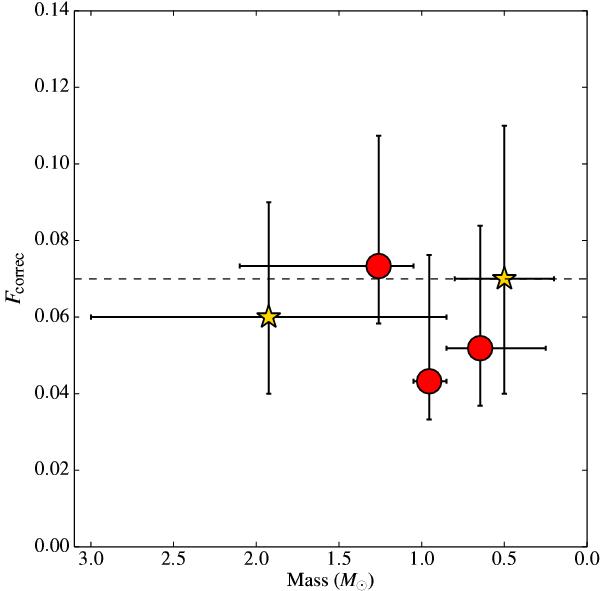
Multiplicity fraction as a function of primary mass; mass bins are represented with x-axis error bars with the average value for the SACY targets being the red markers. Fractions have been corrected using the techniques outlined in Sect. 5.0.2. The same data (Nguyen et al. 2012) shown in Fig. 6 has been transformed from spectral type to mass by assuming an age of 1 Myr and 2 Myr for Tau-Aur and Cha I respectively, using Teff from Luhman (2004) and Sestito et al. (2008) with isochrones explained in Fig. 2.
Current usage metrics show cumulative count of Article Views (full-text article views including HTML views, PDF and ePub downloads, according to the available data) and Abstracts Views on Vision4Press platform.
Data correspond to usage on the plateform after 2015. The current usage metrics is available 48-96 hours after online publication and is updated daily on week days.
Initial download of the metrics may take a while.