Open Access
Fig. 7
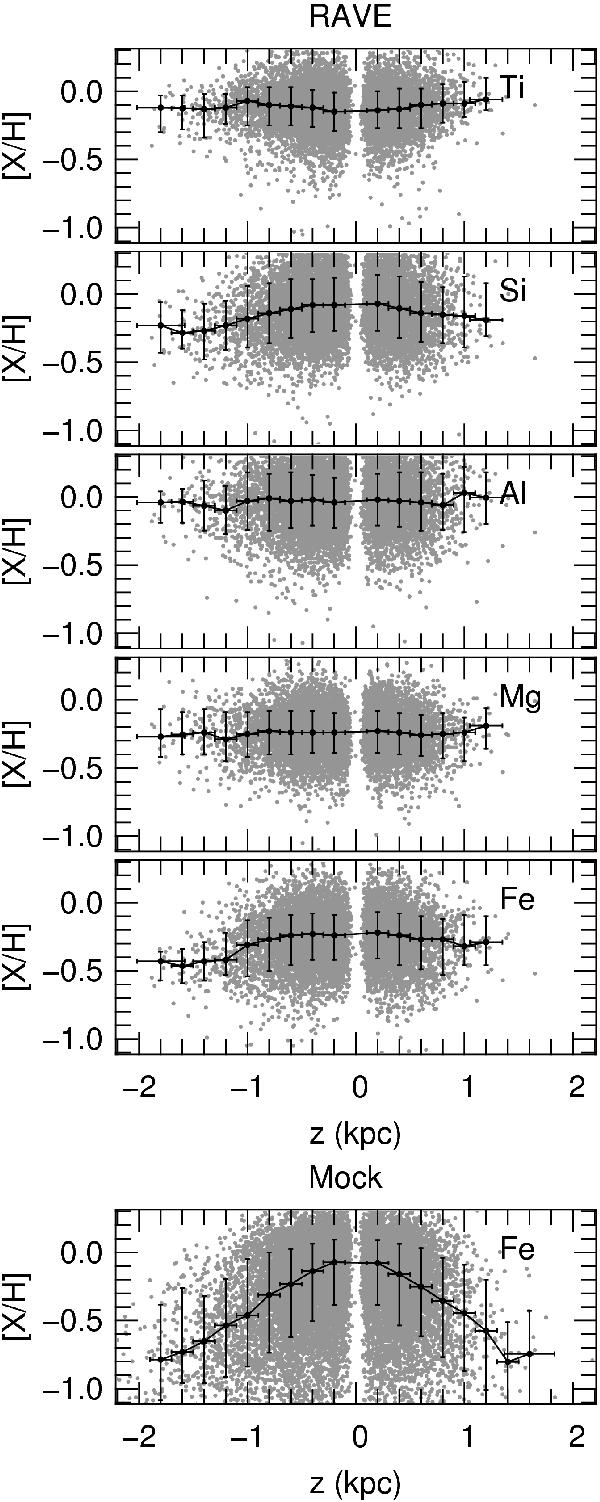
Abundances of the RAVE RC sample (top panels) and RC mock sample (bottom panel) as a function of Z in the range 7.5 <R (kpc) < 8.5. The black points represent the median abundance of the samples in step of 0.2 kpc, while the vertical bars contain 68% of the stars in the bin.
This figure is made of several images, please see below:
Current usage metrics show cumulative count of Article Views (full-text article views including HTML views, PDF and ePub downloads, according to the available data) and Abstracts Views on Vision4Press platform.
Data correspond to usage on the plateform after 2015. The current usage metrics is available 48-96 hours after online publication and is updated daily on week days.
Initial download of the metrics may take a while.