Fig. 1
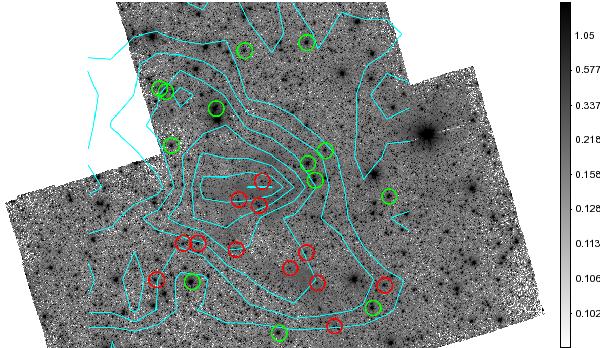
Spitzer 3.6 μm image of Lupus IV. The field of view is 43′ × 54′. North is up, east to the left, and scaling is logarithmic. The locations of the background stars for which the optical depth has been measured are shown as circles (100 pixels, 60′′) radius, which is the outer radius of the annulus used to measure CS). The red circles show the stars included in the sub-sample used in this study. 13CO(2−1) emission is shown in steps of 1 K km s-1 between 0 and 7 K km s-1 as contours.
Current usage metrics show cumulative count of Article Views (full-text article views including HTML views, PDF and ePub downloads, according to the available data) and Abstracts Views on Vision4Press platform.
Data correspond to usage on the plateform after 2015. The current usage metrics is available 48-96 hours after online publication and is updated daily on week days.
Initial download of the metrics may take a while.