Fig. 6
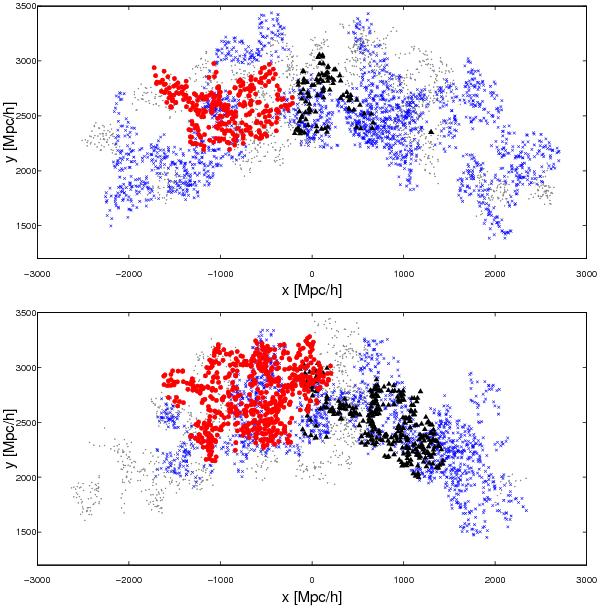
Distribution of QSO systems at the linking length 80 h-1 Mpc in x and y coordinates in two slices of the z coordinate (upper panel: z ≤ 0 h-1 Mpc, lower panel: z> 0 h-1 Mpc). Grey dots denote quasars in systems with 50 ≤ NQSO< 100; blue circles denote quasars in systems with 100 ≤ NQSO ≤ 400, black triangles denote quasars in the second richest system with NQSO = 421, and red filled circles denote quasars in the richest system with NQSO = 920.
Current usage metrics show cumulative count of Article Views (full-text article views including HTML views, PDF and ePub downloads, according to the available data) and Abstracts Views on Vision4Press platform.
Data correspond to usage on the plateform after 2015. The current usage metrics is available 48-96 hours after online publication and is updated daily on week days.
Initial download of the metrics may take a while.