Fig. 1
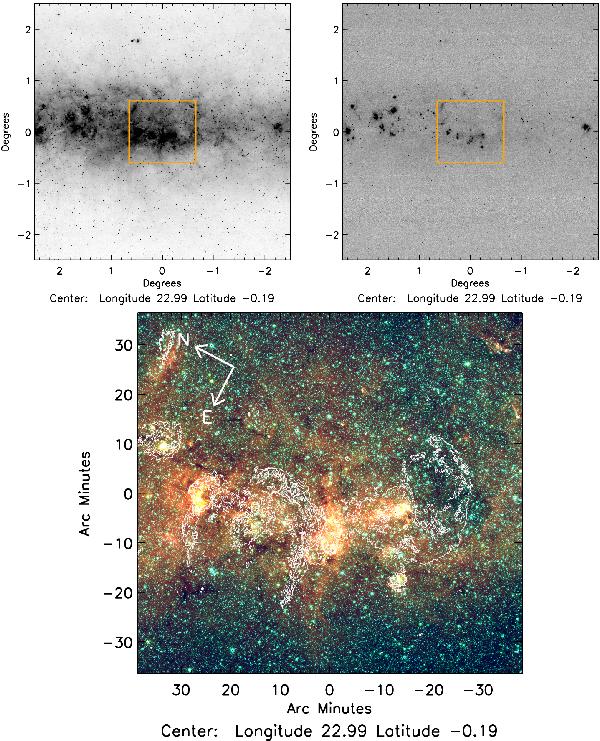
Top: MSX band A (8 μm; left) and band E (20 μm; right) images of G23.3–0.3. The square indicates the area displayed in the composite image at the bottom. Bottom: false-color composite image of the G23.3–0.3 complex, which was created with GLIMPSE data: 3.6 μm (blue), 4.5 μm (green), and 8.0 μm (red). Contours of the 20 cm emission detected by MAGPIS (White et al. 2005; Helfand et al. 2006) at 0.002, 0.003, 0.004 Jy beam-1 levels are super-imposed. Galactic longitude is along the x-axis, and Galactic latitude is along the y-axis.
Current usage metrics show cumulative count of Article Views (full-text article views including HTML views, PDF and ePub downloads, according to the available data) and Abstracts Views on Vision4Press platform.
Data correspond to usage on the plateform after 2015. The current usage metrics is available 48-96 hours after online publication and is updated daily on week days.
Initial download of the metrics may take a while.