Fig. 11
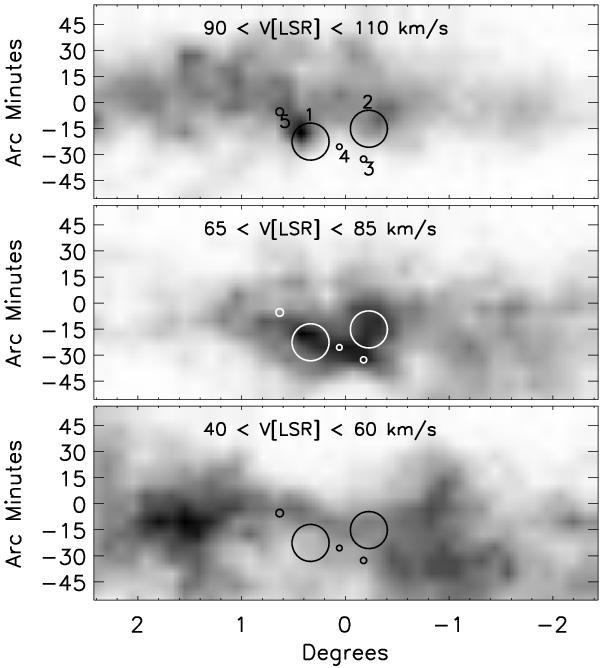
12CO integrated maps in direction of the giant molecular complex G23.3-0.3 (Dame et al. 2001), from 40 km s-1 to 60 km s-1 (bottom panel), from 65 km s-1 to 85 km s-1 (middle panel), and from 90 km s-1 to 110 km s-1 (top panel). Labels refer to SNR1, 2, 3, 4, and 5 in Table 11. Center is at a longitude of  and a latitude of
  .
.
Current usage metrics show cumulative count of Article Views (full-text article views including HTML views, PDF and ePub downloads, according to the available data) and Abstracts Views on Vision4Press platform.
Data correspond to usage on the plateform after 2015. The current usage metrics is available 48-96 hours after online publication and is updated daily on week days.
Initial download of the metrics may take a while.