Fig. B.1
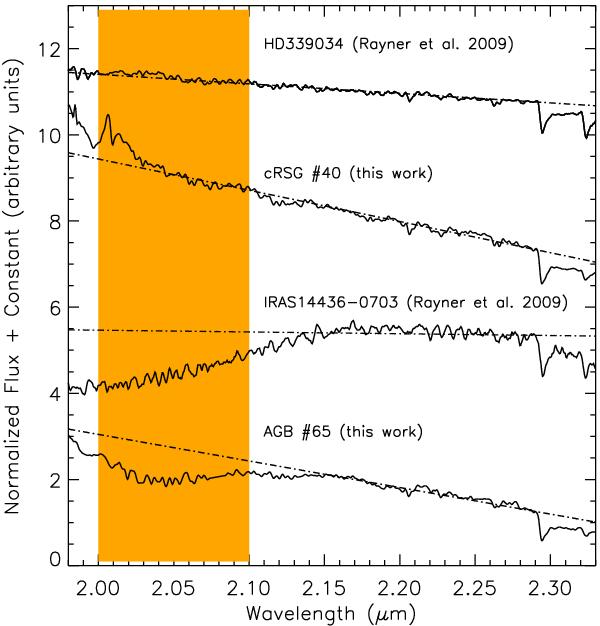
Normalized reddened spectra (arbitrarily shifted for clarity) of late-type stars. As an example, the spectrum of a new cRSG, #40, is compared to the IRTF spectrum of HD 339034 (Rayner et al. 2009); the spectrum of the AGB #65 is compared to the IRTF spectrum of IRAS 14436-0703 (Rayner et al. 2009). The dotted-dashed lines are linear fits to the stellar continuum in the range 2.15–2.29 μm. The darker region is used for measuring an H2O index.
Current usage metrics show cumulative count of Article Views (full-text article views including HTML views, PDF and ePub downloads, according to the available data) and Abstracts Views on Vision4Press platform.
Data correspond to usage on the plateform after 2015. The current usage metrics is available 48-96 hours after online publication and is updated daily on week days.
Initial download of the metrics may take a while.