Fig. 6
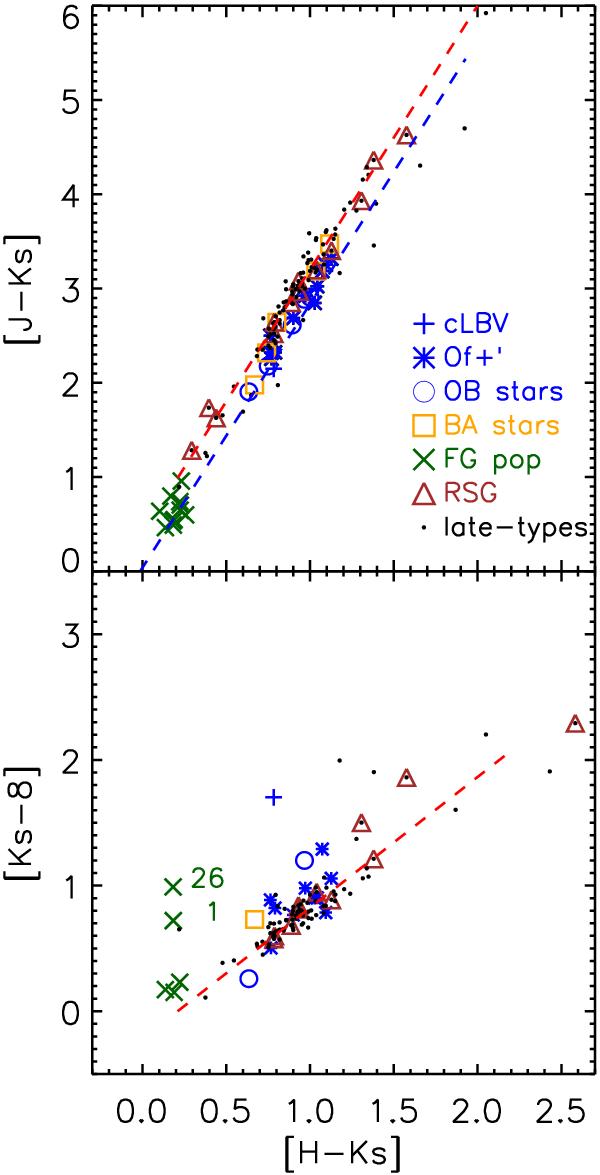
Top panel: J − Ks versus H − Ks diagram of the observed stars. Spectral-types are marked as shown in the figure legend; the two dashed curves indicate the reddening curves of naked M1 and O9 stars. Bottom panel: Ks− 8 versus H − Ks diagram; a reddening curve for an M1 star is shown with a dashed line. Star #22 (cLBV) shows infrared excess at 8 μm. The two foreground stars #1 (OBe) and #26 (B4-A4) have notable infrared excess. Star #7 was not plotted (8 μm confused).
Current usage metrics show cumulative count of Article Views (full-text article views including HTML views, PDF and ePub downloads, according to the available data) and Abstracts Views on Vision4Press platform.
Data correspond to usage on the plateform after 2015. The current usage metrics is available 48-96 hours after online publication and is updated daily on week days.
Initial download of the metrics may take a while.