Fig. 1
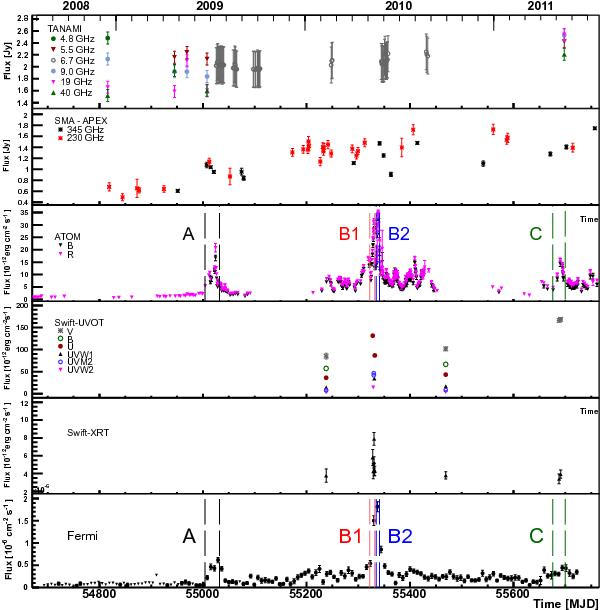
Multiwavelength light curve of PKS 1424−418. From top to bottom: first panel displays radio data from TANAMI in several bands between 4.8 and 40 GHz; second panel displays 230 GHz (red symbols) and 345 GHz (black symbols) data from SMA and APEX, respectively; third panel displays optical B-band (red points) and R-band (green points) data from ATOM, Swift-UVOT data (W1, M2, W2, and V, B, U filters); fourth panel displays Swift-XRT data; fifth panel displays Fermi LAT flux (E> 100 MeV). Vertical lines denote the prominent outbursts studied in this work: black flare A, red flare B1, blue flare B2 and green flare C.
Current usage metrics show cumulative count of Article Views (full-text article views including HTML views, PDF and ePub downloads, according to the available data) and Abstracts Views on Vision4Press platform.
Data correspond to usage on the plateform after 2015. The current usage metrics is available 48-96 hours after online publication and is updated daily on week days.
Initial download of the metrics may take a while.