Fig. 7
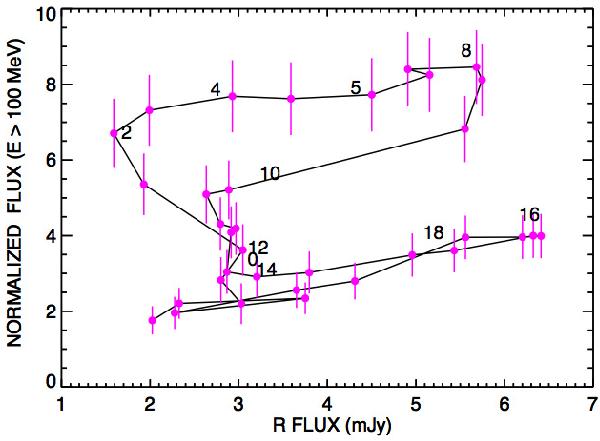
Gamma-ray/optical flux–flux evolution over flare B. LAT 2-day binned fluxes are interpolated to the times of R-band measurements as explained in Sect. 4.1 and plotted on the y-axis. R-band fluxes are plotted on the x-axis. For clarity their errors (typically 5−10% or less) are not shown. Approximate times in days (from MJD 55 322) are indicated along the track.
Current usage metrics show cumulative count of Article Views (full-text article views including HTML views, PDF and ePub downloads, according to the available data) and Abstracts Views on Vision4Press platform.
Data correspond to usage on the plateform after 2015. The current usage metrics is available 48-96 hours after online publication and is updated daily on week days.
Initial download of the metrics may take a while.