Fig. 8
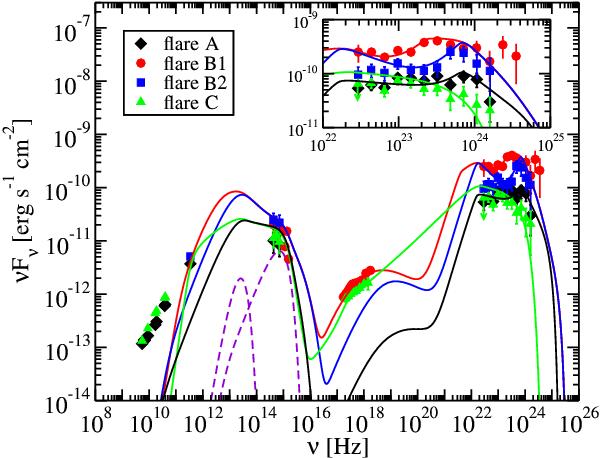
SEDs and model fits for the four flares detected from PKS 1424−418. Simultaneous data for flare A are represented by black symbols, for flare B1 by red symbols, for flare B2 by blue symbols and for flare C by green symbols. The dashed violet lines are the modeled spectra of the dust torus (peaked in the infrared) and accretion disk (peaked in the optical). The solid lines are models of the total emission. The inset shows an enlargement of the LAT spectrum to point out the peculiar concave upwards shape of flares A, B1 and B2.
Current usage metrics show cumulative count of Article Views (full-text article views including HTML views, PDF and ePub downloads, according to the available data) and Abstracts Views on Vision4Press platform.
Data correspond to usage on the plateform after 2015. The current usage metrics is available 48-96 hours after online publication and is updated daily on week days.
Initial download of the metrics may take a while.