Fig. 2
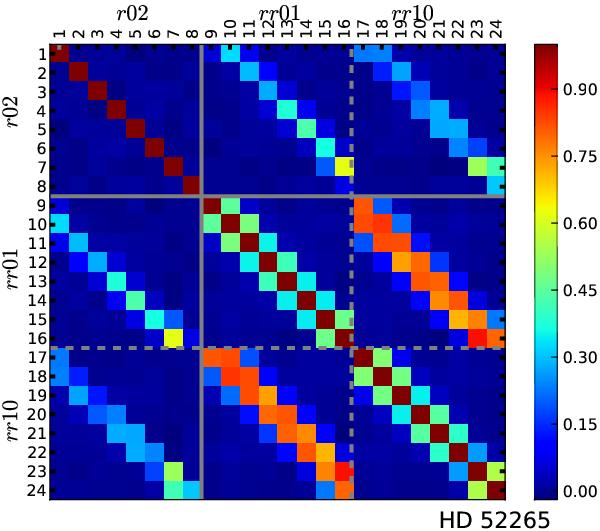
Elements of the correlation matrix of the observed ratios r02(n) and rr01 / 10(n). Lines (columns) 1 to 8 correspond to the r02(n) ratios (n is in the range 17−24). Lines (columns) 9 to 16 correspond to the rr01(n) ratios and lines (columns) 17 to 24 correspond to the rr10(n) ratios (n is in the range 16−23). As expected, there are strong correlations between some of the data, in particular between the rr01(n) and rr10(n) ratios that have the same n value or values of n that differ by one unit.
Current usage metrics show cumulative count of Article Views (full-text article views including HTML views, PDF and ePub downloads, according to the available data) and Abstracts Views on Vision4Press platform.
Data correspond to usage on the plateform after 2015. The current usage metrics is available 48-96 hours after online publication and is updated daily on week days.
Initial download of the metrics may take a while.