Fig. 3
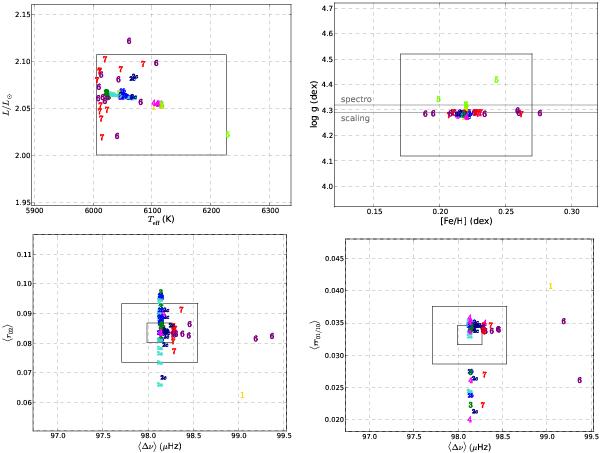
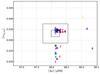
Restoration of the observational constraints in the models. Upper figures are for classical parameters: H-R diagram (left), [Fe/H]-log g plane (right). The inner rectangle delimits the 1σ observational error bars, and the boundaries of the whole plotting area represent 2σ errors. Horizontal lines give the log g values of spectroscopy and seismic scaling. Lower figures are for seismic indicators: ⟨ Δν ⟩-⟨ r02 ⟩ plane (left) and ⟨ Δν ⟩-⟨ rr01/10 ⟩ plane (right). Here, the rectangles delimit 1 and 3σ error bars, and the boundaries of the whole plotting area are 10σ errors. For each point, the symbol corresponds to the model number, as explained in Table 3. We used different colours to highlight the different cases (sets of observational constraints as defined in Table 3) at the basis of the modelling. Note that these colours are unrelated to the colours defined in Table 2 and used in Figs. 4 to 6, and in Fig. 9.
Current usage metrics show cumulative count of Article Views (full-text article views including HTML views, PDF and ePub downloads, according to the available data) and Abstracts Views on Vision4Press platform.
Data correspond to usage on the plateform after 2015. The current usage metrics is available 48-96 hours after online publication and is updated daily on week days.
Initial download of the metrics may take a while.