Fig. 4
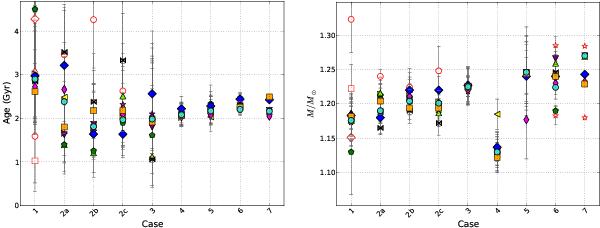
Ranges of ages (left) and masses (right) derived from stellar model optimization for HD 52265. In the abscissae, we list the case numbers as defined in Table 3. For each case, several model optimizations can be identified according to the symbols and colours indicated in Table 2. In addition, open red symbols are for additional models of set A described in Table A.1 of Appendix A.2: circles are for different, low Y0 values, square and diamond are for low and high αconv values, small diamonds for models with large core overshooting. Red stars illustrate the Y0-M degeneracy in cases 6 and 7, but the inferred range is the same for all cases.
Current usage metrics show cumulative count of Article Views (full-text article views including HTML views, PDF and ePub downloads, according to the available data) and Abstracts Views on Vision4Press platform.
Data correspond to usage on the plateform after 2015. The current usage metrics is available 48-96 hours after online publication and is updated daily on week days.
Initial download of the metrics may take a while.