Fig. 5
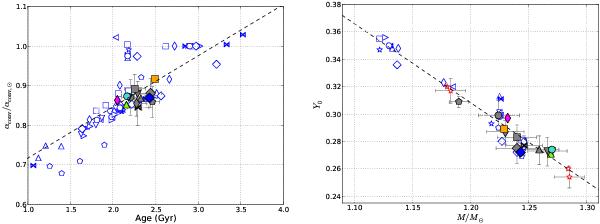
Left: relation between the convection parameter αconv and the age. To compare models, we expressed αconv in units of the solar value, which, as mentioned in Sect. 3.1, mainly depends on the convection theory used in the model, i.e. αconv, ⊙ ,cgm = 0.688 and αconv, ⊙ ,mlt = 1.762. The regression line is αconv/αconv, ⊙ ≃ 0.13 × A + 0.59 (A in Gyr.). Colour symbols are for case 7 models (symbols and colours are listed in Table 2), grey symbols for case 6, and open blue for other cases. Right: relation between the initial helium abundance and the mass of HD 52265, as inferred from model optimization. The regression line is Y0 ≃ −0.58 × M/M⊙ + 1.00. Open red stars illustrate the impact of the Y0-M degeneracy (Table A.1).
Current usage metrics show cumulative count of Article Views (full-text article views including HTML views, PDF and ePub downloads, according to the available data) and Abstracts Views on Vision4Press platform.
Data correspond to usage on the plateform after 2015. The current usage metrics is available 48-96 hours after online publication and is updated daily on week days.
Initial download of the metrics may take a while.