Fig. 6
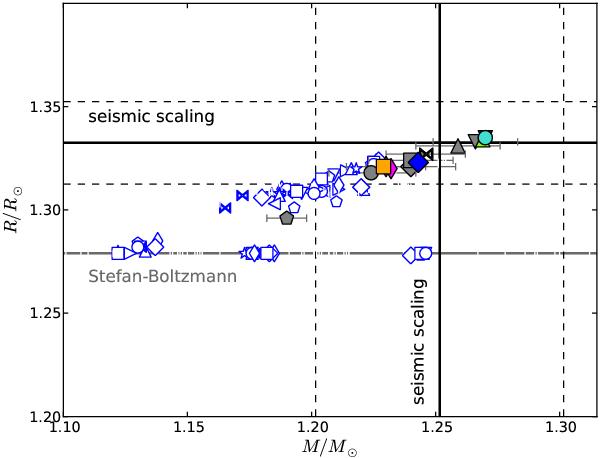
Relation between the radius and the mass of HD 52265, as inferred from model optimization. Colours are for optimized models of case 7 of Table 3 for different input physics, as listed in Table 2. Models for case 6 are plotted in grey, other cases are shown with open blue symbols. Bold solid horizontal and vertical black lines represent the values of the mass and radius derived from the scaling relations (Sect. 2.2.2). The corresponding uncertainties are displayed with dashed lines. The radius obtained using the Stefan-Boltzmann relation (Sect. 2.1) is shown as a triple-dot dashed line. Three groups of models lie on the Stefan-Boltzmann line: case 1, 4, and 5 models, as discussed in the text.
Current usage metrics show cumulative count of Article Views (full-text article views including HTML views, PDF and ePub downloads, according to the available data) and Abstracts Views on Vision4Press platform.
Data correspond to usage on the plateform after 2015. The current usage metrics is available 48-96 hours after online publication and is updated daily on week days.
Initial download of the metrics may take a while.