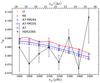
Fig. 7
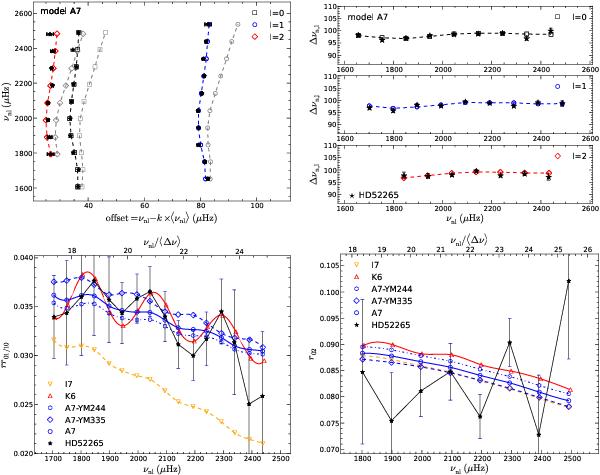
Seismic properties of a selected set of models. Top left panel: échelle diagram for the best model A7, optimized on the basis of the individual frequencies and including – or not – the correction for surface effects. Star symbols represent the observed frequencies, while black squares, blue circles, and red diamonds denote the model frequencies for angular degrees ℓ = 0,1, and 2. In grey, we indicate the corresponding data before correction for surface effects. Top right panel: comparison of observed large frequency separations for case A7 (corrected frequencies). The symbols are the same as in the top right figure. Bottom left panel: comparison of the observed frequency separation ratios rr01 / 10(n) for a selected set of models, including the best model A7 (continuous blue line). Results for models A7-YM-244 (pentagons) and A7-YM335 (diamonds) illustrate the effect of the Y0-M degeneracy. Results for model K6 (continuous red line) show the effect of including convective penetration below the convective envelope, while results for model I7 (dashed orange line) show the effect of a moderate overshooting of the convective core. Bottom right panel: same as in the bottom left figure, but for the r02(n) frequency separation ratios.
Current usage metrics show cumulative count of Article Views (full-text article views including HTML views, PDF and ePub downloads, according to the available data) and Abstracts Views on Vision4Press platform.
Data correspond to usage on the plateform after 2015. The current usage metrics is available 48-96 hours after online publication and is updated daily on week days.
Initial download of the metrics may take a while.