Free Access
Fig. 19
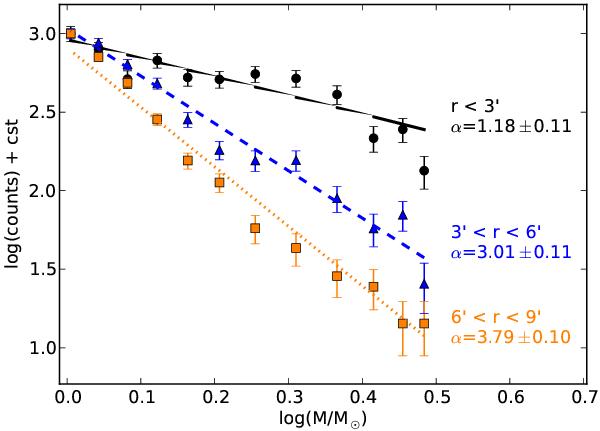
Mass functions obtained in three different regions of the cluster, showing the flattening of the IMF in the centre. The y-axis was shifted so that the observed number of stars in the lowest mass bin is the same for all three.
Current usage metrics show cumulative count of Article Views (full-text article views including HTML views, PDF and ePub downloads, according to the available data) and Abstracts Views on Vision4Press platform.
Data correspond to usage on the plateform after 2015. The current usage metrics is available 48-96 hours after online publication and is updated daily on week days.
Initial download of the metrics may take a while.