Fig. 4
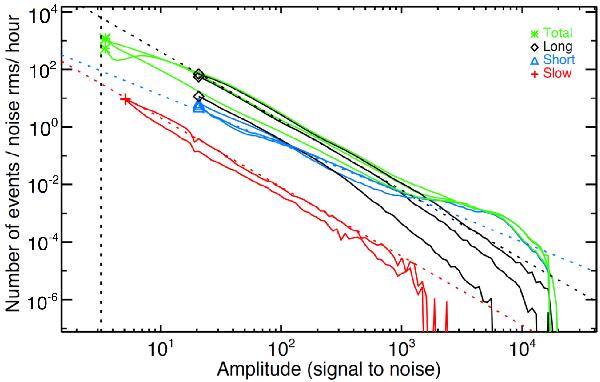
HFI flight results: glitch energy distribution for the three families of glitches with respect to the peak amplitude, in signal-to-noise units, for three different PSB and SWB in-flight bolometers (Planck Collaboration X 2014). The blue line is for the short glitch population, black is for long, red is for slow, and green is for total. Power laws are shown for comparison as dashed lines.
Current usage metrics show cumulative count of Article Views (full-text article views including HTML views, PDF and ePub downloads, according to the available data) and Abstracts Views on Vision4Press platform.
Data correspond to usage on the plateform after 2015. The current usage metrics is available 48-96 hours after online publication and is updated daily on week days.
Initial download of the metrics may take a while.