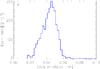
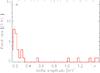
Fig. 5
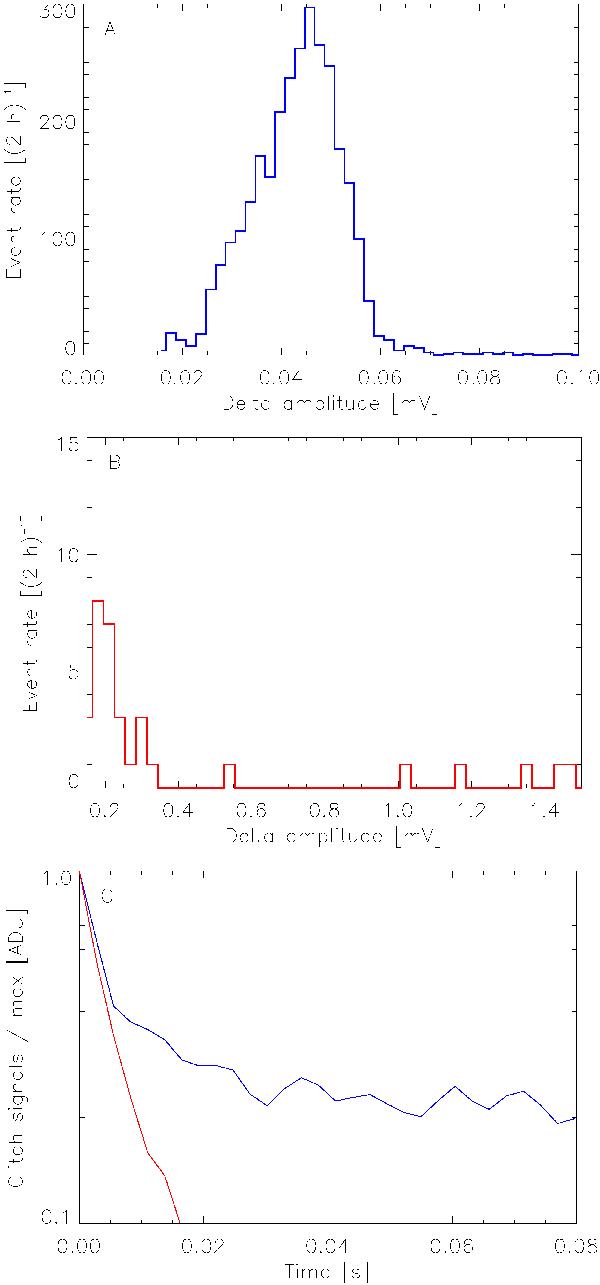
Tandem accelerator test. (A) Histograms of the glitch amplitudes in 2 h of integration time for low amplitudes (0 V – 0.1 mV). (B) Histograms of the glitch amplitudes in 2 h of integration for high amplitudes (greater than 0.1 mV). (C) Glitch template built by stacking all the events of the first family centered at 45 μV (blue) and the family centered at 0.15 mV (red). Both templates show the same fast time-constant τ (4 ms), and the blue template shows a slower time-constant (about 20 ms) with an amplitude relative to the peak of few percent.
Current usage metrics show cumulative count of Article Views (full-text article views including HTML views, PDF and ePub downloads, according to the available data) and Abstracts Views on Vision4Press platform.
Data correspond to usage on the plateform after 2015. The current usage metrics is available 48-96 hours after online publication and is updated daily on week days.
Initial download of the metrics may take a while.