Fig. 5
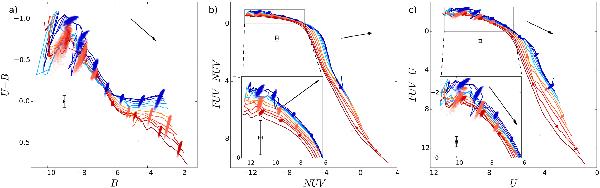
Color vs. magnitude diagrams showing the SSP curves of the 13 metallicities used in the model grid, with discrete model distributions of age log 10(t/ yr) = 7, 7.5, 8, 8.5, 9, 9.5, and 10 (young models are top left and old models are bottom right in each panel), for three metallicities: Z = 0.019 (red), 0.005 (orange) and 0.00019 (blue). Each distribution contains 1000 discrete cluster models with mass fixed to log (M/M⊙) = 4, and the SSPs are scaled to the mass of the clusters. The reddest SSP line indicates highest metallicity Z = 0.03 and the bluest SSP line indicates lowest metallicity Z = 0.00013. The 1-σ (σ = 0.15 mag for FUV and NUV, and 0.05 mag for U and B passbands) error bars show the standard deviations of the photometric accuracy. The black arrows indicate the extinction vector, computed for AV = 1 mag. Panel a) shows the situation in optical bands alone, while in panels b) and c), ultraviolet information is present, and the zoom plots show details at young age.
Current usage metrics show cumulative count of Article Views (full-text article views including HTML views, PDF and ePub downloads, according to the available data) and Abstracts Views on Vision4Press platform.
Data correspond to usage on the plateform after 2015. The current usage metrics is available 48-96 hours after online publication and is updated daily on week days.
Initial download of the metrics may take a while.