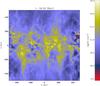
Fig. 2
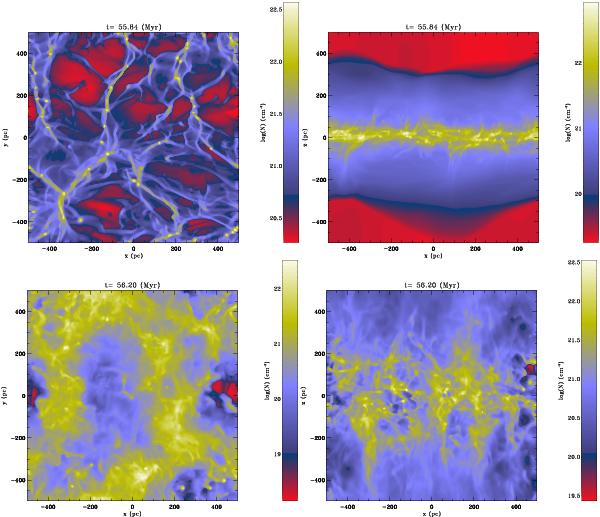
Column density along the z-axis (left panels) and along the y-axis (right panels) for the run with no feedback, NF1, (upper panels) and the run with scheme D (lower panels). Comparison with Fig. 1 clearly shows the drastic impact of the feedback. In particular, the run NF1 shows thin and long filaments in which self-gravitating fragments develop, indicating that the gas is primarily organised by self-gravity and undergoes run away collapse. The galactic disc is considerably thinner than when supernovae are included. On the other hand, run D shows a broader galactic disc than in runs C1 and C2, illustrating the importance of the spatial correlation between supernovae explosions and dense gas.
Current usage metrics show cumulative count of Article Views (full-text article views including HTML views, PDF and ePub downloads, according to the available data) and Abstracts Views on Vision4Press platform.
Data correspond to usage on the plateform after 2015. The current usage metrics is available 48-96 hours after online publication and is updated daily on week days.
Initial download of the metrics may take a while.