Fig. 1
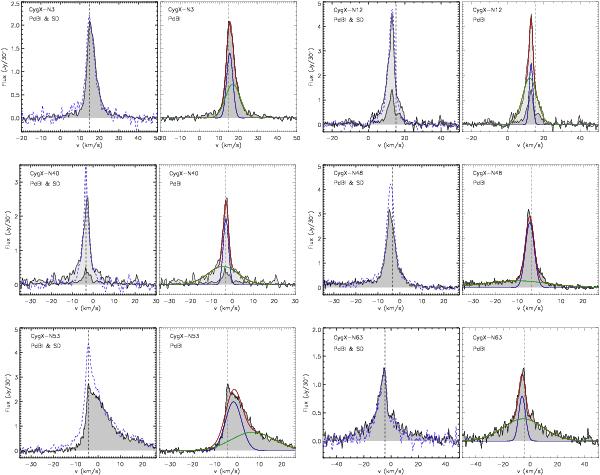
Average spectra for the six MDCs of our sample (labelled on the top-left corners). The left side of each subfigure shows the comparison of the single-dish (SD) IRAM 30 m pointed observations (Motte et al. 2007) in blue dashed lines, and the spectra of our PdBI SiO observations integrated over the central 30′′ × 30′′ (equivalent to the IRAM 30 m beam) are shadowed in grey. The vertical black dashed lines show the systemic velocity of each core, as measured with N2H+ by Bontemps et al. (2010). The right side shows the same PdBI SiO emission as the left, overplotted with a two-component Gaussian fit to illustrate the existence of narrow (in blue) and broad (in green) components of emission (whose sum is shown in red). For CygX-N12 and N40, we show a shadowed spectrum (in light grey) which corresponds to the PdBI emission integrated over an area of 50′′ × 50′′ (to assess a possible contamination from strong SiO emission outside the SD primary beam).
Current usage metrics show cumulative count of Article Views (full-text article views including HTML views, PDF and ePub downloads, according to the available data) and Abstracts Views on Vision4Press platform.
Data correspond to usage on the plateform after 2015. The current usage metrics is available 48-96 hours after online publication and is updated daily on week days.
Initial download of the metrics may take a while.