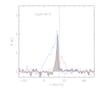
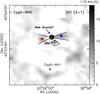
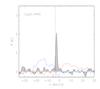
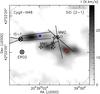
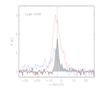
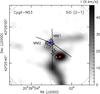
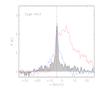
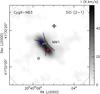
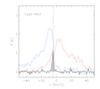
Fig. A.2
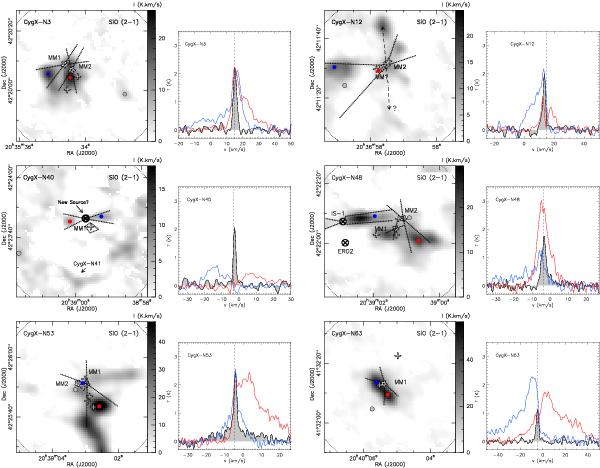
SiO emission (in units of Tmb) of the six MDCs studied. For each MDC we show, on the left, a greyscale showing the total integrated SiO emission and, on the right, three overlaid spectra extracted from the datacubes. The grey, blue, and red circles in the left-hand panels show the positions of the grey, blue, and red spectra displayed on the right. The grey spectra exemplify the narrow profile of the SiO emission, and the blue and red spectra are taken at positions where there is significant wing emission. Sources and outflow directions are as labelled in Figs. 2 and 3.
Current usage metrics show cumulative count of Article Views (full-text article views including HTML views, PDF and ePub downloads, according to the available data) and Abstracts Views on Vision4Press platform.
Data correspond to usage on the plateform after 2015. The current usage metrics is available 48-96 hours after online publication and is updated daily on week days.
Initial download of the metrics may take a while.