Fig. 2
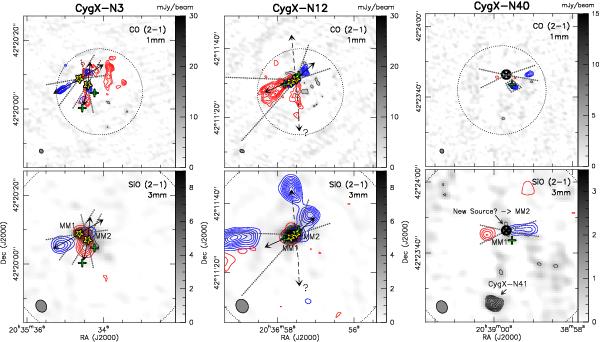
Comparison of the high-velocity CO and SiO emission in CygX-N3 (left), N12 (centre), and N40 (right). The top panels show the high-velocity CO emission in contours (with the velocity ranges as in Duarte-Cabral et al. 2013) over the 1 mm continuum emission in greyscale. The primary beam of the CO and 1mm observations is shown as a dashed circle, and the synthetic beam is in the lower-left corner. Contours are stepped by 0.25 Jy beam-1 km s-1, starting at 2.0 (2.75) Jy beam-1 km s-1 for N3 blue (red), 1.5 Jy beam-1 km s-1 for N12, and 1.75 (1.25) Jy beam-1 km s-1 for N40 blue (red). The lower panels show the high-velocity SiO emission in contours (with velocity ranges as in Table 2) over the 3 mm continuum emission in greyscale for the same sources. The primary beams are shown as dashed circles and the synthetic beams are plotted in the lower-left corners. Contours are stepped by 0.1 Jy beam-1 km s-1, starting at 0.15 Jy beam-1 km s-1 for N3, 0.2 (0.05) Jy beam-1 km s-1 for N12 blue (red), and 0.2 Jy beam-1 km s-1 for N40. The most massive protostars are marked with yellow stars (and labelled in the lower panels), and the least massive fragments from Bontemps et al. (2010) are shown as green crosses. The arrows are the directions of the outflows inferred from Duarte-Cabral et al. (2013), and the dashed lines show the respective outflow cones.
Current usage metrics show cumulative count of Article Views (full-text article views including HTML views, PDF and ePub downloads, according to the available data) and Abstracts Views on Vision4Press platform.
Data correspond to usage on the plateform after 2015. The current usage metrics is available 48-96 hours after online publication and is updated daily on week days.
Initial download of the metrics may take a while.