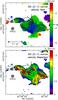
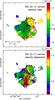
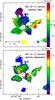
Fig. 5
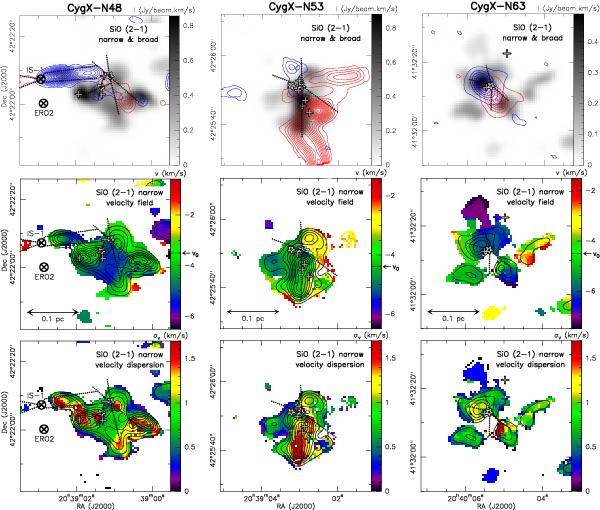
Same as Fig. 4, for CygX-N48 (left), N53 (centre), and N63 (right). Top panels have the narrow SiO emission in greyscale and the high-velocity (broad) SiO emission in contours as in Fig. 3. The two lower rows show the integrated narrow SiO emission in contours (with steps of 0.1 Jy beam-1 km s-1, starting at 0.1 Jy beam-1 km s-1), with the respective moment maps in colour scale: the velocity field (first moment map) in the middle row, and the velocity dispersion (second moment map) in the last row. Annotations are as in Fig. 3.
Current usage metrics show cumulative count of Article Views (full-text article views including HTML views, PDF and ePub downloads, according to the available data) and Abstracts Views on Vision4Press platform.
Data correspond to usage on the plateform after 2015. The current usage metrics is available 48-96 hours after online publication and is updated daily on week days.
Initial download of the metrics may take a while.