Fig. 6
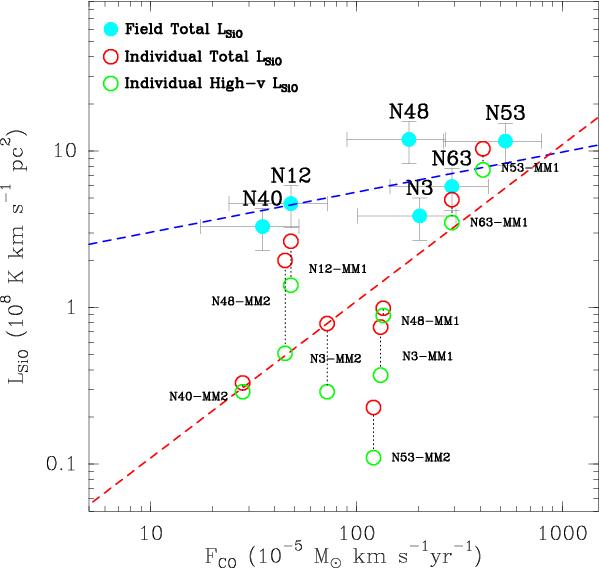
Observed LSiO against the corresponding FCO (from Duarte-Cabral et al. 2013). The light blue filled circles correspond to the total LSiO and total FCO for each of the six fields, and the blue dashed line is the respective linear fit in a log-scale. The open circles are for the resolved individual outflows (integration spatially constrained to location of the individual outflows), with the FCO estimated in Duarte-Cabral et al. (2013; Table 3, Col. 6). The red open circles have LSiO estimated using the entire velocity range (Table 3, Col. 7), and the respective linear fit to the log-values is shown as a dashed red line, which translates into a linear correlation of LSiO ∝ FCO. The green open circles show the LSiO only from the outflow high-velocity wing emission (Table 3, Col. 8).
Current usage metrics show cumulative count of Article Views (full-text article views including HTML views, PDF and ePub downloads, according to the available data) and Abstracts Views on Vision4Press platform.
Data correspond to usage on the plateform after 2015. The current usage metrics is available 48-96 hours after online publication and is updated daily on week days.
Initial download of the metrics may take a while.