Fig. 7
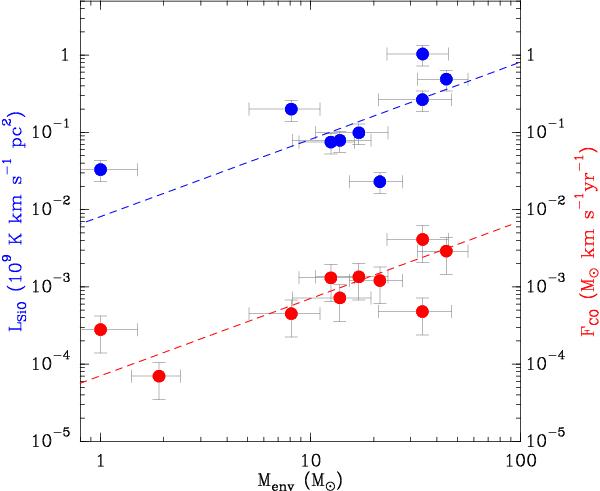
Observed LSiO (same as the red open circles in Fig. 6) and FCO, in blue and red circles, respectively, with respect to the envelope masses (Menv) for individual sources. The second red point from the left corresponds to CygX-N40 MM1, for which we have an FCO measurement, but no LSiO. The dashed red line shows the linear correlation of FCO = 7.5 × 10⁻⁵Menv, originally found by Bontemps et al. (1996) for low-mass protostars, and confirmed in Duarte-Cabral et al. (2013) to extend to the high-mass regime. The dashed blue line shows the linear correlation of LSiO ≃ 5 × 10⁶Menv that we find for the blue points. This figure accentuates the fact that LSiO of individual outflows follows the same trend as FCO (both being ∝Menv), even though it introduces more scatter with respect to the linear relation found for FCO.
Current usage metrics show cumulative count of Article Views (full-text article views including HTML views, PDF and ePub downloads, according to the available data) and Abstracts Views on Vision4Press platform.
Data correspond to usage on the plateform after 2015. The current usage metrics is available 48-96 hours after online publication and is updated daily on week days.
Initial download of the metrics may take a while.