Fig. 9
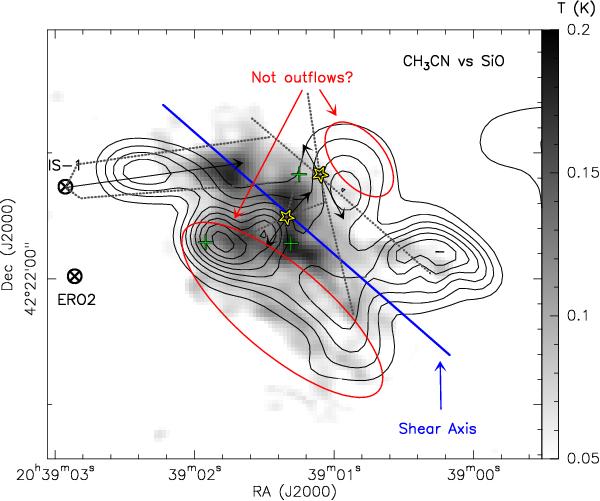
Map of the CygX-N48 integrated intensity of CH3CN from (Csengeri et al. 2011b) in greyscale, overlaid with the SiO systemic velocity emission from this paper in contours (for both molecules the velocity integration range was from −6.5 to −0.5 km s-1). The red ellipses show the regions with narrow SiO emission adjacent to the clear velocity shear found in N2H+, shown here as a blue line. Even though there are strong and compact SiO peaks coincident with high-velocity emission as seen in Fig. 5, the weaker and more extended SiO systemic velocity emission could be associated with the lower-velocity shocks from this velocity shear.
Current usage metrics show cumulative count of Article Views (full-text article views including HTML views, PDF and ePub downloads, according to the available data) and Abstracts Views on Vision4Press platform.
Data correspond to usage on the plateform after 2015. The current usage metrics is available 48-96 hours after online publication and is updated daily on week days.
Initial download of the metrics may take a while.