Fig. 1
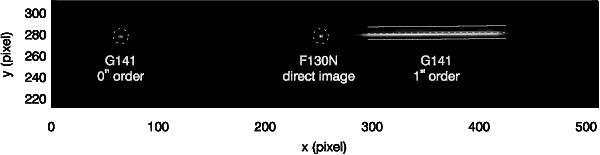
Example of a WFC3/G141 spectral image with the undispersed stellar image (0th order and 1st-order spectrum. The associated F130N direct image is superimposed. The spectral trace is shown by a dotted line that extends in the dispersion direction over a wavelength range 1.1–1.7 μm. The plain lines above and below the trace show the width of the extraction region.
Current usage metrics show cumulative count of Article Views (full-text article views including HTML views, PDF and ePub downloads, according to the available data) and Abstracts Views on Vision4Press platform.
Data correspond to usage on the plateform after 2015. The current usage metrics is available 48-96 hours after online publication and is updated daily on week days.
Initial download of the metrics may take a while.