Fig. 13
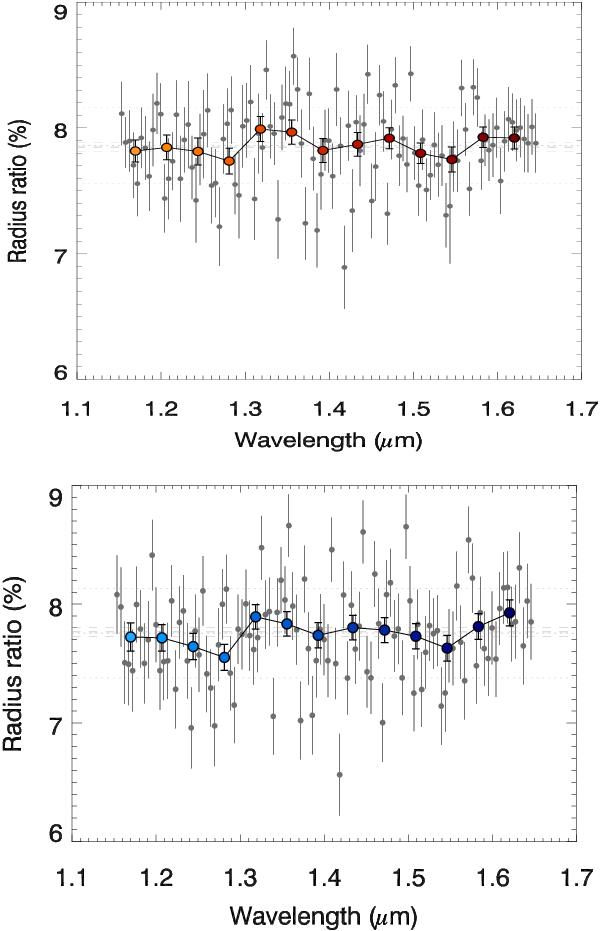
WFC3/G141 transmission spectrum of GJ 3470b unbinned (grey dots) and binned by 8 (large coloured dots), obtained with the oot-divide (top panel) and differential (bottom panel) methods. The dotted horizontal lines indicate the mean and standard deviation values. The broad-band radius ratio from the white light curve and its 1σ uncertainty are shown by dashed horizontal lines.
Current usage metrics show cumulative count of Article Views (full-text article views including HTML views, PDF and ePub downloads, according to the available data) and Abstracts Views on Vision4Press platform.
Data correspond to usage on the plateform after 2015. The current usage metrics is available 48-96 hours after online publication and is updated daily on week days.
Initial download of the metrics may take a while.