Fig. 16
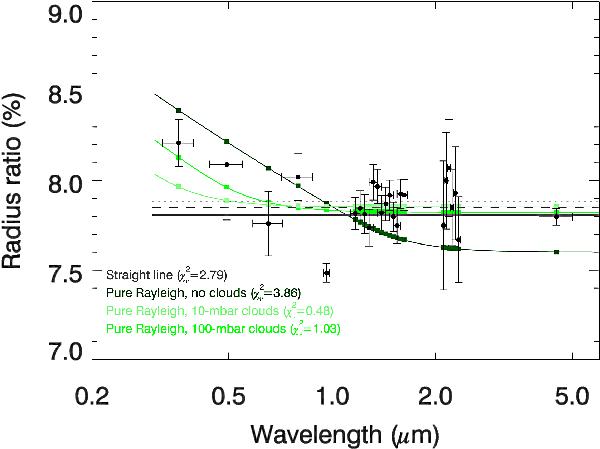
Simple transmission spectrum models: straight-line (thick grey horizontal line) and pure-Rayleigh’s (green curves) vs. all radius ratio measurements of GJ 3470b (black dots; same as in Fig. 14). Squares show the models value over the measurement band passes. The WFC3 broad-band radius ratio and its 1σ uncertainty are represented by the dashed and dotted lines, respectively.
Current usage metrics show cumulative count of Article Views (full-text article views including HTML views, PDF and ePub downloads, according to the available data) and Abstracts Views on Vision4Press platform.
Data correspond to usage on the plateform after 2015. The current usage metrics is available 48-96 hours after online publication and is updated daily on week days.
Initial download of the metrics may take a while.