Fig. 6
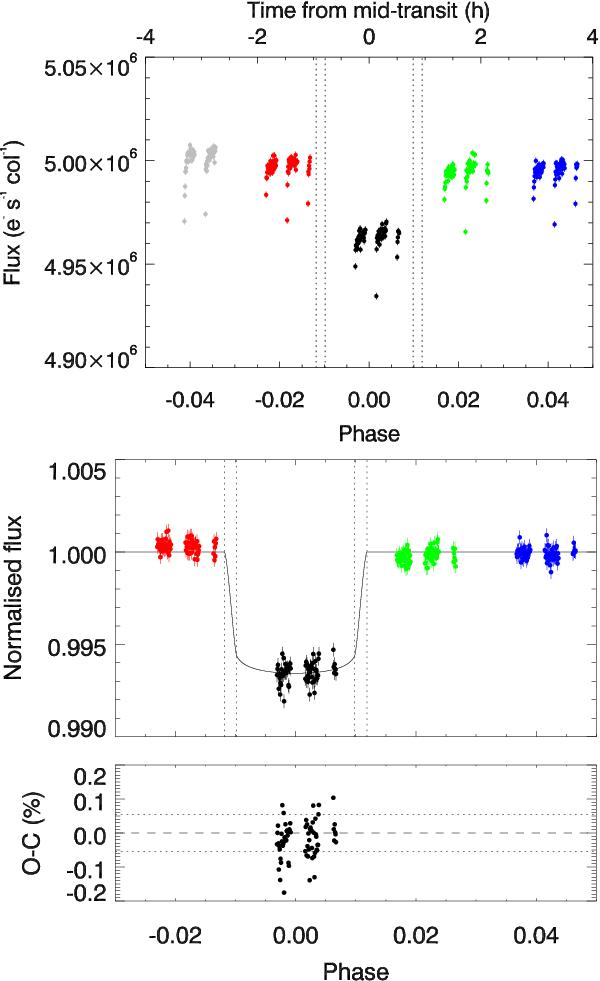
Top panel: Raw white light curve of GJ 3470. Photometric points obtained during each HST orbit are shown in a different colour. The transit contacts of GJ 3470b are indicated by vertical dashed lines. Middle panel: corrected white light curve of GJ 3470. The systematics in the in-transit (third) HST orbit (black dots) have been corrected by dividing the fluxes by a correction template, built as the mean of the second (red dots) and fourth (green dots) HST orbits (which are shown here also divided by this correction template). The black curve is the best fit to the corrected white light curve. Bottom panel: observed minus calculated values (O − C). The two horizontal dotted lines indicate the standard deviation of the residuals in the in-transit (third) HST orbit.
Current usage metrics show cumulative count of Article Views (full-text article views including HTML views, PDF and ePub downloads, according to the available data) and Abstracts Views on Vision4Press platform.
Data correspond to usage on the plateform after 2015. The current usage metrics is available 48-96 hours after online publication and is updated daily on week days.
Initial download of the metrics may take a while.