Fig. 1
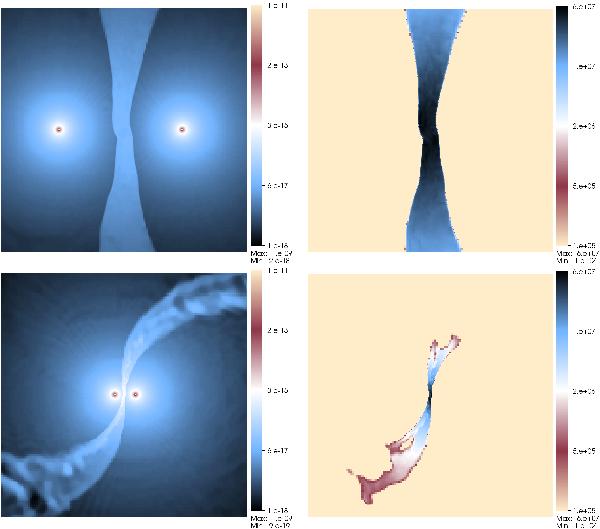
Simulation snapshots showing the orbital (x − y) plane at orbital phases, φ = 0.5 (top) and 1.0 (bottom). The left and right columns show density (in units of g cm-3) and temperature (in K), respectively. All plots show the full x − y extent of the domain = ± 2.06 × 1014 cm = 2963R⊙− for comparison, the primary and secondary star have a radius of 20 and 16R⊙, respectively (see Sect. 2.2 for further details). At apastron (top row) the primary star is to the right, and vice-versa at periastron (bottom row).
Current usage metrics show cumulative count of Article Views (full-text article views including HTML views, PDF and ePub downloads, according to the available data) and Abstracts Views on Vision4Press platform.
Data correspond to usage on the plateform after 2015. The current usage metrics is available 48-96 hours after online publication and is updated daily on week days.
Initial download of the metrics may take a while.