Free Access
Fig. 4
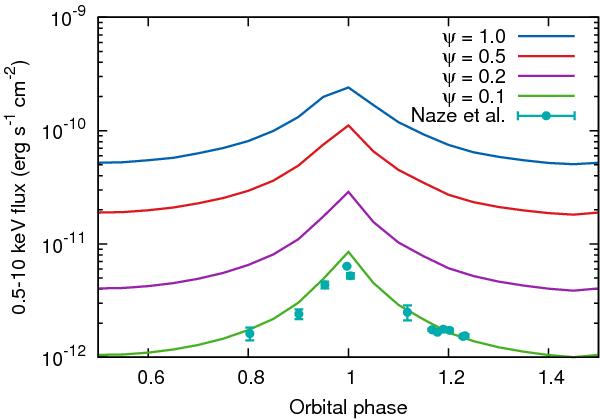
0.5−10 keV X-ray lightcurve compared against the observed fluxes derived by Nazé et al. (2012b). The different curves correspond to different reduction factors for the wind mass-loss rates, ψ (see Eq. (15)).
Current usage metrics show cumulative count of Article Views (full-text article views including HTML views, PDF and ePub downloads, according to the available data) and Abstracts Views on Vision4Press platform.
Data correspond to usage on the plateform after 2015. The current usage metrics is available 48-96 hours after online publication and is updated daily on week days.
Initial download of the metrics may take a while.