Fig. 6
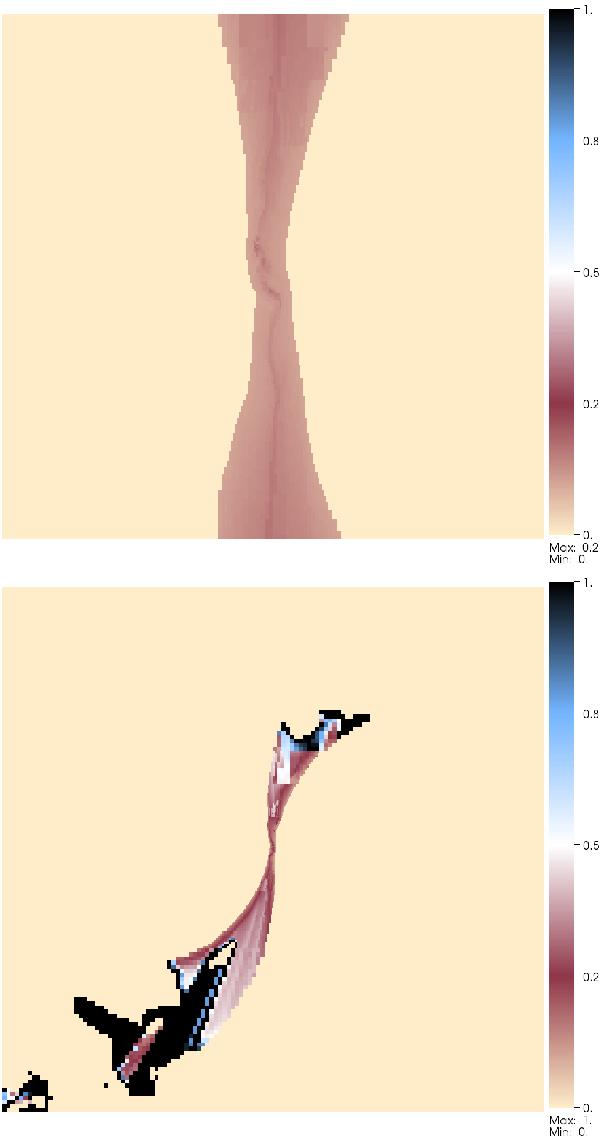
Spatial distribution of the ratio of electron-to-ion temperature, Te/T, from a model calculation with τe−i( = Te/T | 0) = 0.1 and ψ = 0.1. The orbital (x − y) plane is shown at phases, φ = 0.5 (top) and 1.0 (bottom). All plots show the full x − y extent of the domain (see Sect. 2.2). Note that values of Te/T in the un-shocked winds are plotted as zero to aid visibility but are taken to be unity in the X-ray calculations.
Current usage metrics show cumulative count of Article Views (full-text article views including HTML views, PDF and ePub downloads, according to the available data) and Abstracts Views on Vision4Press platform.
Data correspond to usage on the plateform after 2015. The current usage metrics is available 48-96 hours after online publication and is updated daily on week days.
Initial download of the metrics may take a while.