Fig. 8
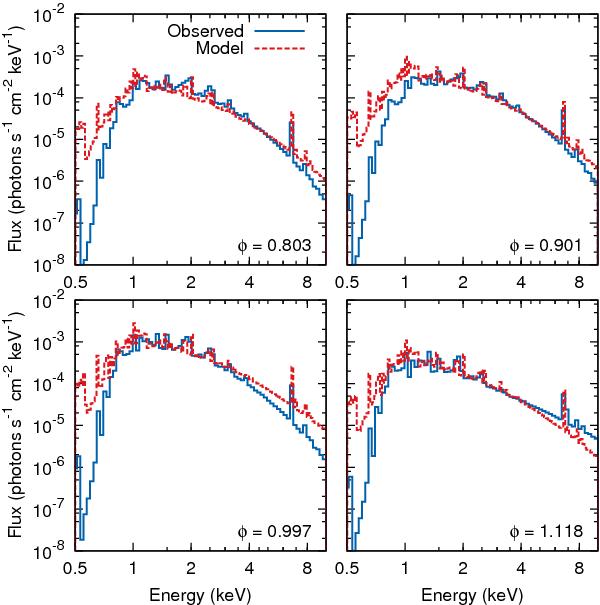
Comparison of the best-fit model X-ray spectra to observations. The model was calculated using reduced mass-loss rates (ψ = 0.13; Ṁ1 = 6.5 × 10⁻⁷ M⊙ yr-1 and Ṁ2 = 7.5 × 10⁻⁷ M⊙ yr-1) and τe−i = 0.1. The observed X-ray spectra at φ = 0.803, 0.901, and 1.118 were acquired with Swift and the φ = 0.997 spectrum was acquired with XMM-Newton (Nazé et al. 2012b). (The observed spectra correspond to the fits with “one temperature fixed” presented by Nazé et al.2012b.) Orbital phases of the observations (φ) are noted in the plots.
Current usage metrics show cumulative count of Article Views (full-text article views including HTML views, PDF and ePub downloads, according to the available data) and Abstracts Views on Vision4Press platform.
Data correspond to usage on the plateform after 2015. The current usage metrics is available 48-96 hours after online publication and is updated daily on week days.
Initial download of the metrics may take a while.