Fig. 10
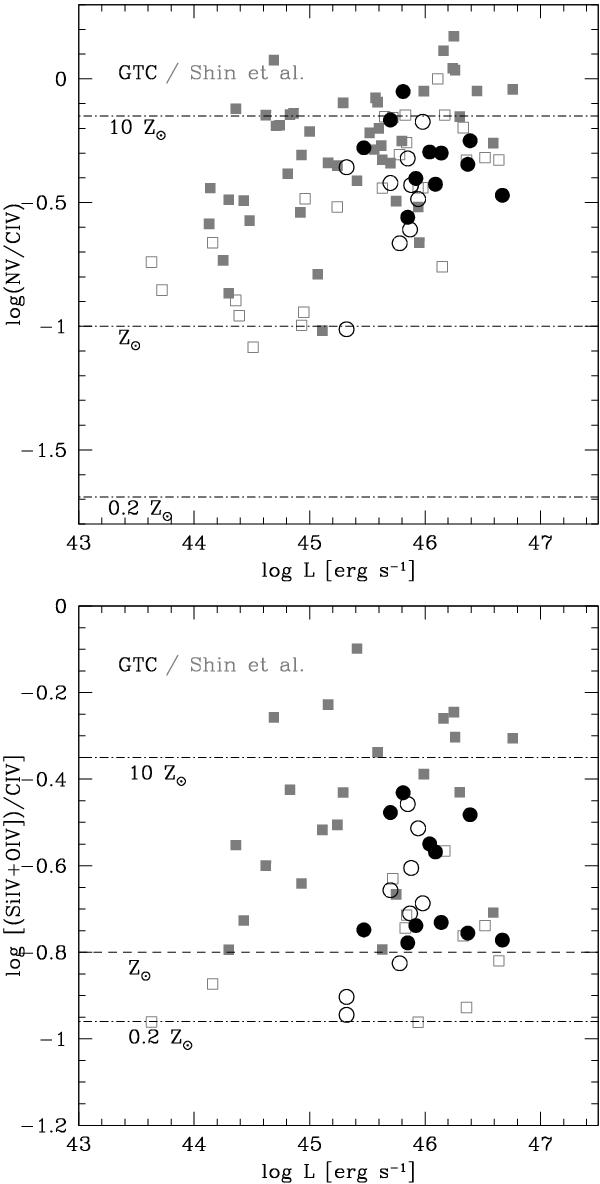
Metallicity-sensitive line intensity ratios as a function of bolometric luminosity for the sample of Shin et al. (2013; gray squares) and the GTC sample (black circles). Open symbols are for population B sources, filled symbols for population A. The ordinate of the top panel is the decimal logarithm of the intensity ratio between Nvλ1240 and Civλ1549; the ordinate of the bottom panel is the decimal logarithm of the intensity ratio of the 1400 Å blend due to multiplets of SiIV and OIV], and Civλ1549. The dashed lines show the value expected for 0.2, 1, and 10 times solar metallicity following the LOC models reported in Nagao et al. (2006b).
Current usage metrics show cumulative count of Article Views (full-text article views including HTML views, PDF and ePub downloads, according to the available data) and Abstracts Views on Vision4Press platform.
Data correspond to usage on the plateform after 2015. The current usage metrics is available 48-96 hours after online publication and is updated daily on week days.
Initial download of the metrics may take a while.