Fig. 12
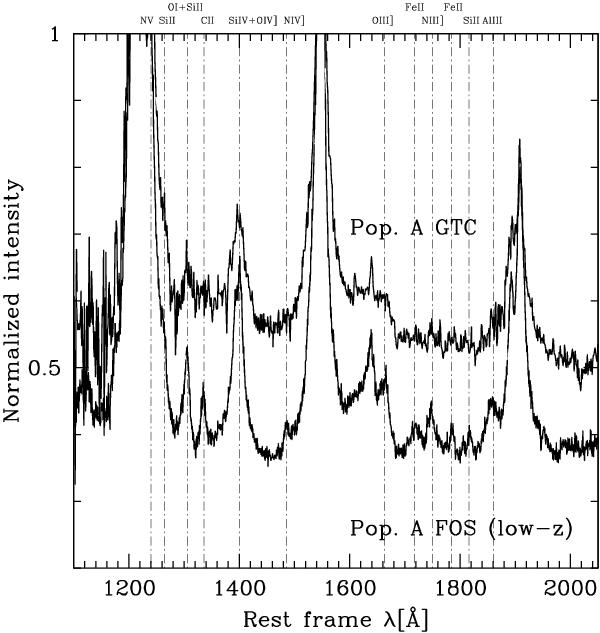
Median spectra of population A for the GTC sample (top) and for the spectra for the low-z sample of Bachev et al. (2004; bottom). The continuum has been flattened and the intensity-limit cut set to emphasize faint features that are possibly related to differences in the metal content. The displacement of the two spectra is due to an artificial offset.
Current usage metrics show cumulative count of Article Views (full-text article views including HTML views, PDF and ePub downloads, according to the available data) and Abstracts Views on Vision4Press platform.
Data correspond to usage on the plateform after 2015. The current usage metrics is available 48-96 hours after online publication and is updated daily on week days.
Initial download of the metrics may take a while.