Free Access
Fig. 2
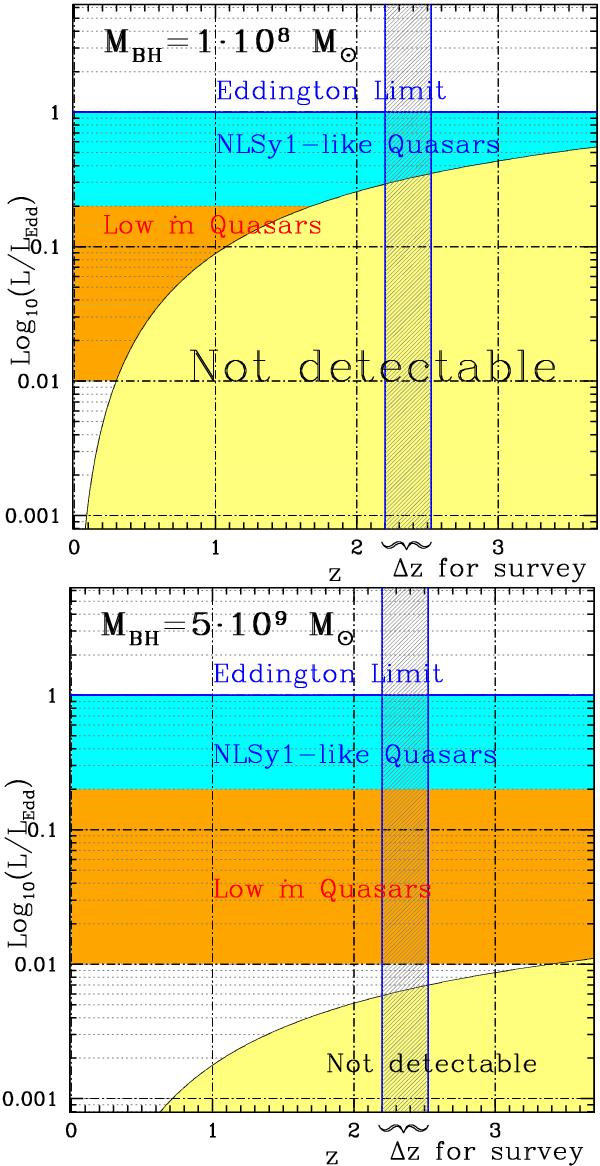
Eddington ratio as a function of redshift, with the area of undetectable sources below a limiting magnitude mB ≈ 21.5) in yellow. The redshift range of the quasar survey is identified by the dashed strip. See text for further details.
This figure is made of several images, please see below:
Current usage metrics show cumulative count of Article Views (full-text article views including HTML views, PDF and ePub downloads, according to the available data) and Abstracts Views on Vision4Press platform.
Data correspond to usage on the plateform after 2015. The current usage metrics is available 48-96 hours after online publication and is updated daily on week days.
Initial download of the metrics may take a while.