Fig. 6
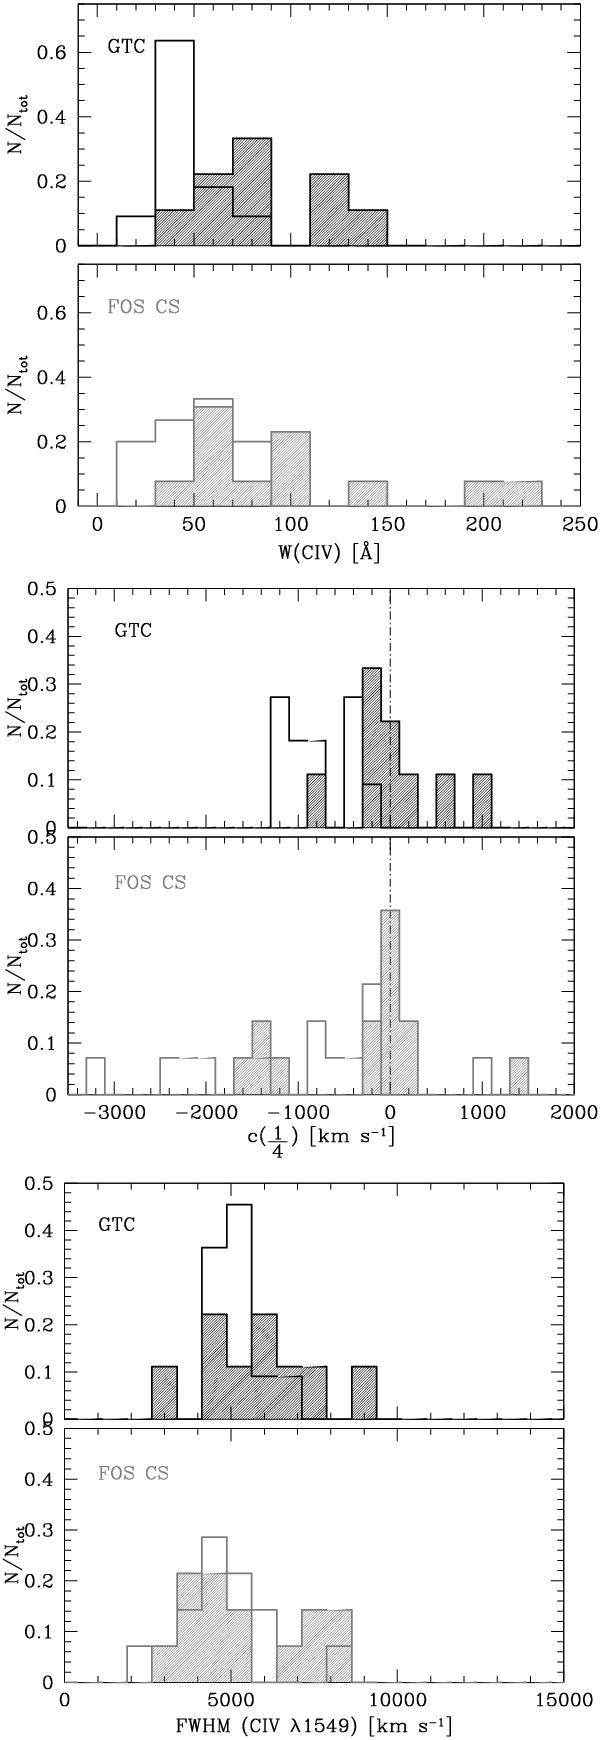
Top to bottom: distributions of W(Civλ1549) for GTC (upper
panel; black) and one realization of the FOS CS (gray). The shaded histogram refers
to population B sources. Middle: the same for the distributions of
 ; bottom: the same
for the distributions of FWHM(Civλ1549).
; bottom: the same
for the distributions of FWHM(Civλ1549).
Current usage metrics show cumulative count of Article Views (full-text article views including HTML views, PDF and ePub downloads, according to the available data) and Abstracts Views on Vision4Press platform.
Data correspond to usage on the plateform after 2015. The current usage metrics is available 48-96 hours after online publication and is updated daily on week days.
Initial download of the metrics may take a while.