Free Access
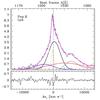
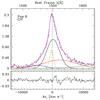
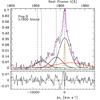
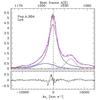
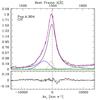
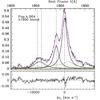
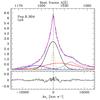
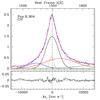
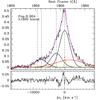
Fig. 8
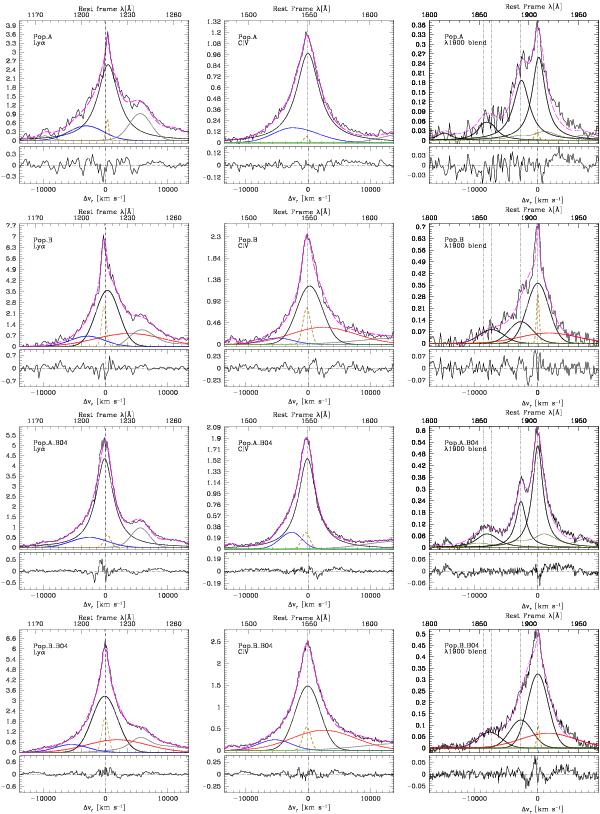
Fits to the emission lines in Population A and B GTC median spectra. The two lower panels show the same analysis for the Bachev et al. (2004) median composites. The meaning of colors and symbols is the same as that in Figs. 4 and 5.
This figure is made of several images, please see below:
Current usage metrics show cumulative count of Article Views (full-text article views including HTML views, PDF and ePub downloads, according to the available data) and Abstracts Views on Vision4Press platform.
Data correspond to usage on the plateform after 2015. The current usage metrics is available 48-96 hours after online publication and is updated daily on week days.
Initial download of the metrics may take a while.