Fig. 11
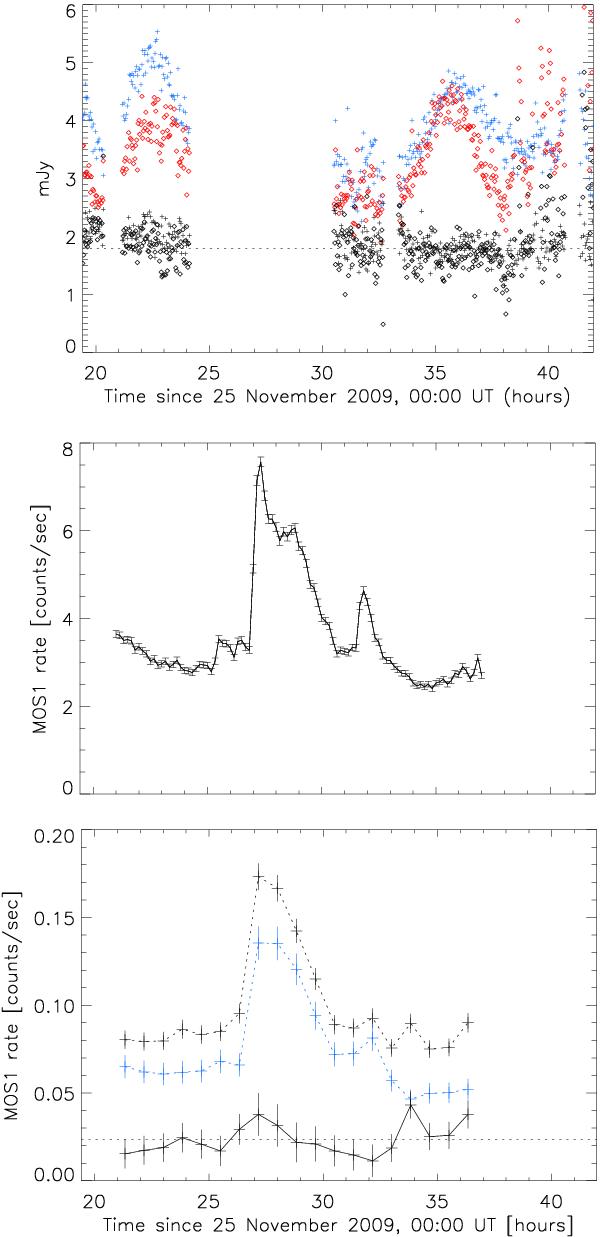
Coronal light curves of AB Dor A and Rst 137B, the components of the latter cannot be separated in any of these data. Upper panel: radio flux density of AB Dor A at 5.5 (blue) and 9.0 GHz (red). For Rst 137B the black plus symbols and diamonds represent the two frequencies. The horizontal line denotes the mean flux of Rst 137B at 5.5 GHz. Middle panel: soft X-ray count rate of AB Dor A in XMM-Newton’s MOS1 detector (0.5−2.0 keV), binned to 600 sec, the bars represent 1σ errors. Lower panel: same as middle panel for Rst 137B with rates binned to 3000 s. As Fig. 1 illustrates, the signal at the position of Rst 137B (black dotted line) is highly contaminated with photons of AB Dor A. After subtracting our background estimate (blue dotted), we arrive at the continuous black graph which shows the count rate of Rst 137Ba+b. The horizontal dotted line indicates the corresponding mean, see Sect. 2.3 for details.
Current usage metrics show cumulative count of Article Views (full-text article views including HTML views, PDF and ePub downloads, according to the available data) and Abstracts Views on Vision4Press platform.
Data correspond to usage on the plateform after 2015. The current usage metrics is available 48-96 hours after online publication and is updated daily on week days.
Initial download of the metrics may take a while.